Measuring my own productivity
Data Vizualization for my university application
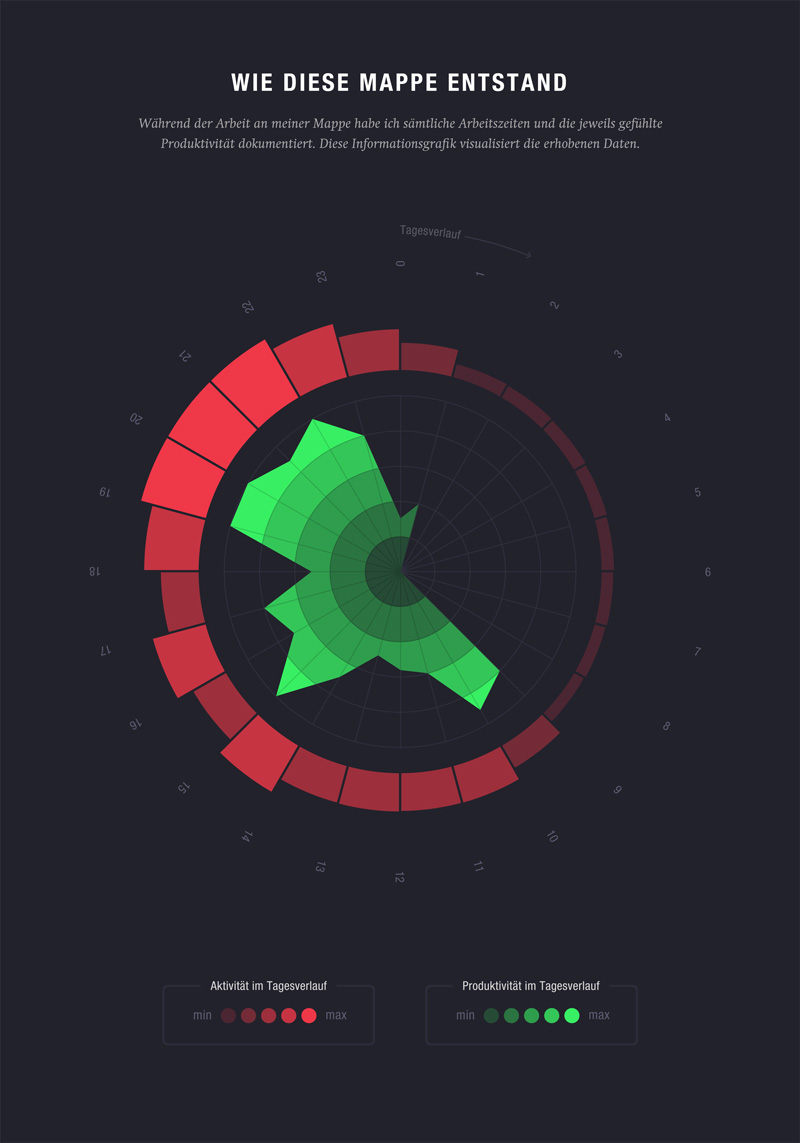
This is a data visualization poster I made in 2012. It was part of my application for the interaction design program at Hochschule für Gestaltung Schwäbisch Gmünd.
It took me about four weeks to complete my application portfolio. I documented the time whenever I worked on it and also rated how productive I felt. The visualization reveals that I prefer to work in the quiet evening hours, which is when I’m also most productive.